
Market report · Dane County
Madison and Dane County housing market report
How is the Madison housing market right now? In October 2026, the median single-family home in Dane County sold for $494,000, about even with last October, and homes went under contract in a median of 15 days. With about 2.3 months of supply, sellers still have a slight edge heading into winter.
This is the page we send our own clients every month. Every town we cover is laid out side by side, followed by what the numbers mean if you are selling, what they mean if you are buying, and a plain-English guide to reading them. We update it at the start of each month with the latest South Central Wisconsin MLS data.
$494,000
Median single-family sale
377
Single-family homes sold
15
Median days on market
2.3
Months of supply
Market figures: Dane County single-family sales, October 2026, South Central Wisconsin MLS.
Every town at a glance: October 2026
Single-family homes first, then condos. The change in parentheses compares October 2026 with October 2025. Tap any town to open its full neighborhood guide.
Single-family homes
Area | Median sale | Homes sold | Median days | Sold vs. asking | Months of supply |
|---|---|---|---|---|---|
Dane County | $494,000 (even) | 377 (down 17%) | 15 | 99.2% | 2.3 |
$489,900 (up 10%) | 150 (down 9%) | 11 | 99.5% | 2.1 | |
$669,900 (down 3%) | 19 (even) | 11 | 99.5% | 2.7 | |
$425,000 (down 16%) | 38 (up 58%) | 16 | 99.6% | 2.0 | |
$550,000 (up 9%) | 9 (down 59%) | 9 | 99.5% | 1.7 | |
$605,000 (down 6%) | 16 (down 27%) | 27 | 99.0% | 2.3 | |
$680,000 (up 20%) | 9 (down 57%) | 17 | 98.9% | 3.1 | |
$465,000 (up 8%) | 12 (up 71%) | 12 | 99.1% | 1.2 | |
$610,000 (up 1%) | 14 (down 44%) | 23 | 98.4% | 1.5 |
Condos
Area | Median sale | Condos sold | Median days | Months of supply |
|---|---|---|---|---|
Dane County | $320,000 (up 8%) | 87 (down 24%) | 20 | 3.2 |
Madison | $300,000 (up 9%) | 43 | 20 | 2.9 |
Middleton | $250,000 | 8 | 21 | 3.6 |
Sun Prairie | $246,500 | 4 | 3 | 2.4 |
Verona | $317,500 | 5 | 4 | 3.5 |
Waunakee | $315,000 | 3 | 11 | 2.7 |
Fitchburg | $340,000 | 5 | 16 | 4.1 |
McFarland | Only 2 sales | 2 | - | 2.0 |
Oregon | Only 2 sales | 2 | - | 2.5 |
In other words, the smaller the town, the more one month can swing. Verona, Fitchburg and most of the condo numbers are based on fewer than 10 sales, so we treat those as a signal, not a trend, and lean on the 2026 numbers in each neighborhood guide.
The villages and close-in neighborhoods: 2026 so far
These areas only see a couple dozen sales a year, so we track them year to date instead of month by month. Figures cover January 1 to October 31, 2026, with the same period in 2025 in parentheses.
Area | Homes sold | Median sale | Median days | Sold vs. asking |
|---|---|---|---|---|
23 (19) | $815,000 ($1,150,000) | 12 | 95.8% | |
16 (20) | $1,187,500 ($1,500,000) | 8 | 98.5% | |
19 (27) | $819,000 ($890,000) | 10 | 97.8% | |
60 (66) | $508,750 ($455,250) | 6 | 100.2% |
Single-family homes. Maple Bluff's lower median this year reflects a few smaller homes on North Sherman Avenue selling alongside ten sales over $1 million, not a drop in values. Condo sales in these areas are rare: none in Maple Bluff and two in Shorewood Hills so far this year, while Monona has had 13, at a median of $436,500.
Curious what this means for your home?
Get a home value based on the sales on your street, not a citywide average.
What this means if you are selling
Sellers still have the edge, but pricing matters more than it did in spring. With about 2.3 months of supply countywide, demand is still ahead of inventory, and homes sold for about 99% of their asking price in October. Homes are taking a couple of days longer to go under contract than a year ago, which tells us buyers are being more careful about price.
Winter can work in your favor. New single-family listings were down about 9% from last October, so a well-prepared home listed in the next few months faces less competition. Buyers out in November and December are usually serious ones, often relocating for work at UW, Epic or the hospitals.
Our recommendation: price your home from the sales on your street and in your pocket of town, not the countywide median. Two homes a mile apart can sell very differently here. If you are thinking about selling in the next six months, we will pull the exact numbers for your home.
Get your home valueRead the Seller's Guide
What this means if you are buying
Prices are steady, and the pace has slowed a little. The countywide single-family median was about even with last October, so this is not a market running away from buyers. Homes are sitting a few days longer, which gives you a bit more time to see a home twice and think it through.
Where you have room, and where you don't. Condos have the most breathing room right now, with about 3.2 months of supply and sales averaging about 98% of asking. McFarland, Oregon and Verona are the opposite: all three have under two months of supply, so well-priced homes there still move quickly.
Our recommendation: get pre-approved before you tour, and know your number for each town you are considering. When the right home comes up in a tight market, you want to be ready to write that week.
Read the Buyer's GuideSearch homes for sale
How to read these numbers
You don't know what you don't know, and market reports are full of terms nobody explains. Here is what each one means, and why it matters to you.
Months of supply
How long it would take to sell every home on the market if no new listings came up. As a general guide, under about 3 months favors sellers, 3 to 6 months is balanced, and over 6 months favors buyers. If you are selling and supply is low, homes tend to sell faster and closer to asking, so pricing right from day one matters more than leaving room to negotiate.
Sold vs. asking
The sale price as a share of the last asking price, averaged across sales. At 100%, homes are selling right at asking. Above 100% usually means multiple offers. Around 98 to 99%, which is where most of Dane County sits this fall, buyers are negotiating a little but sellers are still getting close to their price.
Median days on market
How long the typical home took to go under contract. Half sold faster, half took longer. When this number creeps up, buyers have more time to decide, and a home that sits well past the local median is usually a sign the price needs another look.
Median vs. average price
The median is the middle sale, so half sold for more and half for less. The average adds everything up and divides, which means one lakefront sale can pull it way up. That is why we lead with the median. In a small market like Maple Bluff, look at both.
Price per square foot
A way to compare homes of different sizes. If the median drops but price per square foot holds or rises, smaller homes sold that month, not that values fell. You will see us point this out in the neighborhood guides.
New listings
How many homes came on the market that month. Fewer new listings means less competition for sellers and fewer choices for buyers. It is often the first number to move when the market starts to shift.
Explore the neighborhood guides
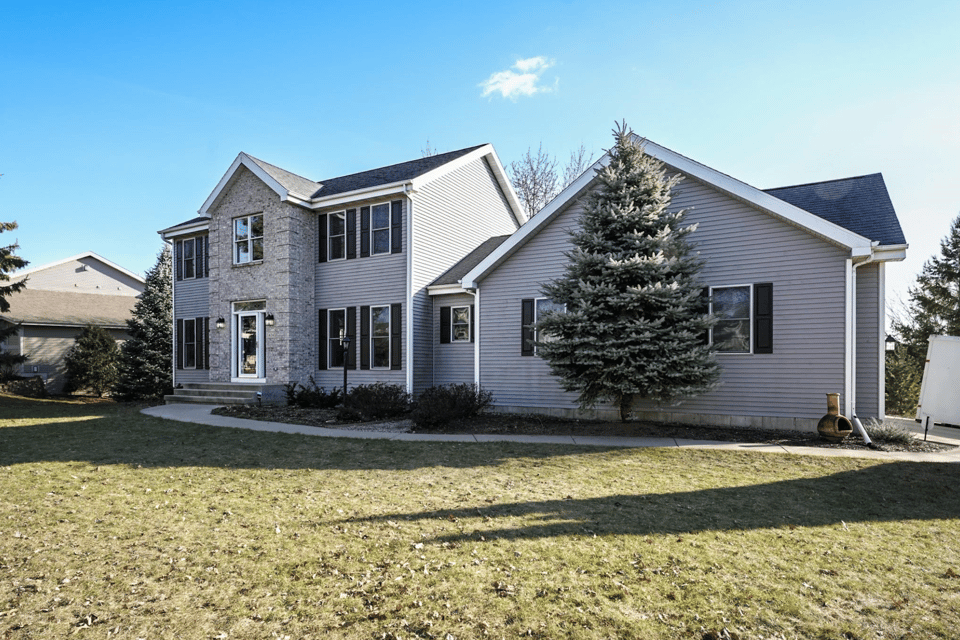
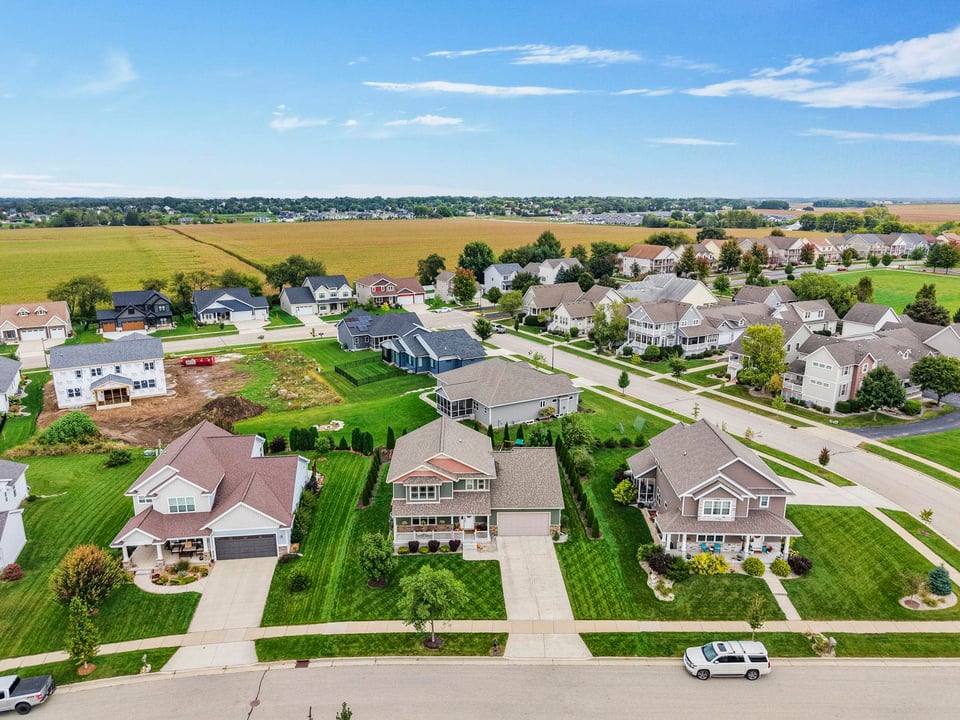
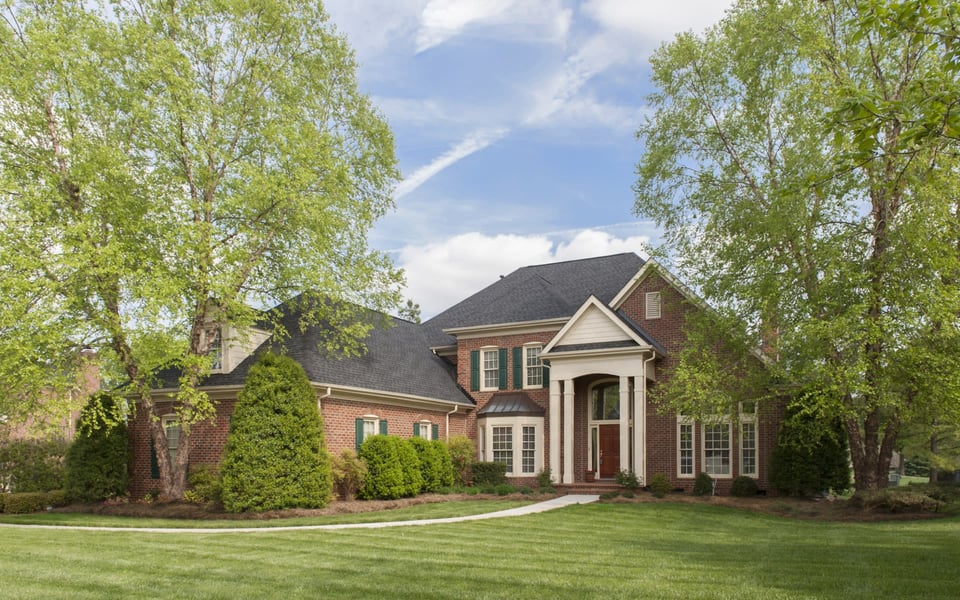
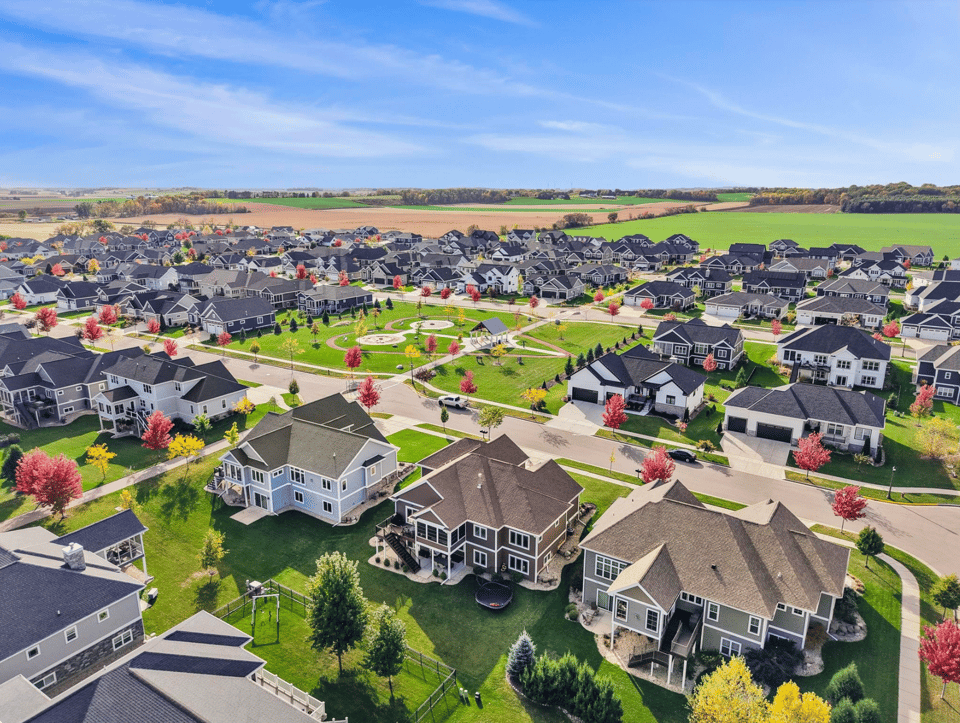
Each guide goes deeper than the numbers: where each neighborhood sits, what drives home values, what it costs to own, and how the year actually feels.



Want the numbers for your home or your search?
Countywide numbers only tell part of the story. We will pull the recent sales on your street or in the neighborhoods you are considering and walk you through what they mean for you. Call or text 608-576-1125, or grab 15 minutes on our calendar.
Source: South Central Wisconsin MLS. Monthly figures cover October 1 to 31, 2026, compared with October 2025, filtered by city within Dane County. Village and neighborhood figures cover single-family sales from January 1 to October 31, 2026, by municipality (Nakoma by subdivision). Report pulled November 16, 2026. Data deemed reliable but not guaranteed. Insiders Realty | REAL Broker, LLC.